Raymo et al. [2006] Science paper: Data and hi-res figures
LR04 5.3 m.y. oxygen isotope stack and table of Marine Isotope Stage ages – from Lisiecki and Raymo [2005] Paleoceanography. Also at NGDC
Late Pliocene ODP662 data: Tropical Atlantic ~1.5-3.5 m.y.
Vostok ice core data/methane time scale – from Ruddiman and Raymo [2003]
Draut et al. [2003] Climate Stability During the Pliocene Warm Period data. Includes 4 m.y. ODP981 record.
Pleistocene isotope records: Sites 664, 677, 607 and 552 – from Raymo et al. [1997]
Raymo [1997] The Timing of Major Climate Terminations data
DSDP Site 607 benthic isotope record – from Raymo et al. [1989], Ruddiman et al. [1989] and Raymo [1992]. Includes 3.3 m.y. DSDP607 O18 and C13 records.
PLIO-PLEISTOCENE ICE VOLUME, ANTARCTIC CLIMATE, AND THE GLOBAL d18O RECORD – Raymo et al. [2006] Science
You can download the data/model results shown in paper here (also at NGDC): Raymoetal_2006_datatoweb.xls
Here are high resolution versions of the figures:
Figure 1, Figure 2, Figure 3
NORTH ATLANTIC PLEISTOCENE ISOTOPE RECORDS – Raymo et al. [2004] Paleoceanography
The following files are the data published in Raymo et al. [2004] “Stability of North Atlantic water masses in face of pronounced climate variability during the Pleistocene”, Paleoceanography, v. 19, PA2008, doi:10.1029/2003PA000921. Please see Table 1 of this paper for more information about sites and sources of data. The age model (ageSBP90) is based on correlation of each record to the tuning target of Shackleton et al. [1990]. This data can also be found at NGDC.
Species adjustments used to correct data to Cibicidoides values:
Uvigerina: d18O = -0.64; d13C= +0.9
Melonis: d18O = -0.34; d13C= +0.8
Cassidulina: d18O = -0.3; d13C= +1.2
s980-981ageSBP90isocib.txt = Cibicidoides data used in constructing figures 4-6. Previously published sections of this record include McManus et al. [1999] 980 data from 0-44.81 mcd; Oppo et al. [1998] 980 data from 44.91-65.53 mcd; and Flower et al. [2000] 980 data from 65.77-93.81 mcd. The 980 and 981 records are spliced at 861 kyrBP.
s980-981isocibsmooth.txt = data shown in figures 2 and 3. These are original Cibicidoides data linearly interpolated to a uniform 3-kyr spacing and smoothed with a five-point running mean.
s982ageSBP90isocib.txt = Cibicidoides data used in constructing figures 4-6 that were originally published by Venz et al. [1999] and Venz and Hodell [2002].
s982isocibsmooth.txt = data shown in figures 2 and 3. These are original Cibicidoides data linearly interpolated to a uniform 3-kyr spacing and smoothed with a five-point running mean.
s983ageSBP90isocib.txt = Cibicidoides data used in constructing figures 4-6. Previously published sections of this record include Kleiven et al. [2003] data from 84.86-145.49 mcd; Raymo et al. [1998] data from 152.31-179.55 mcd; and McIntyre et al. [1999] data from 179.59-287.66 mcd.
s983isocibsmooth.txt = data shown in figures 2 and 3 of Raymo et al. [2004]. These are original Cibicidoides data linearly interpolated to a uniform 3-kyr spacing and smoothed with a five-point running mean.
s984ageSBP90isoadj.txt = multi-species data set from which figure 6 and smoothed figure 2 data were derived. Data from 0-74.64 mcd was run at WHOI; data from 75.45-121.20 mcd was run at Univ. of South Florida; data below 121.25 mcd was run at MIT. (Note: this file was modified on 8/30/04. In the previous version, a compilation error at BU resulted in incorrect species adjustments in the 75-121 mcd interval. The “cib only” file was not affected.)
s984ageSBP90isocib.txt = data used in constructing figures 4 and 5 which includes only Cibicidoides data.
s984isocibsmooth.txt = data shown in figure 3. These are original Cibicidoides data linearly interpolated to a uniform 3-kyr spacing and smoothed with a five-point running mean.
s552ageSBP90isocib.txt = Cibicidoides data used in constructing figures 4-6 that were originally published by Shackleton and Hall [1984].
s552isocibsmooth.txt = data shown in figures 2 and 3. These are original Cibicidoides data linearly interpolated to a uniform 3-kyr spacing and smoothed with a five-point running mean.
s607ageSBP90isoadj.txt = data set from which figure 6 and smoothed figure 2 data was derived that was originally published by Ruddiman et al. [1989] and Raymo et al. [1989].
s607ageSBP90isocib.txt = data used in constructing figures 4 and 5 which includes only Cibicidoides data and which were originally published by Ruddiman et al. [1989] and Raymo et al. [1989].
s607isoadjsmooth.txt = data shown in figure 2. These are original multi-species data linearly interpolated to a uniform 3-kyr spacing and smoothed with a five-point running mean.
s607isocibsmooth.txt = data shown in figure 3. These are original Cibicidoides data linearly interpolated to a uniform 3-kyr spacing and smoothed with a five-point running mean.
s846ageSBP90isocib.txt = Cibicidoides data used in constructing figures 4-6 that were originally published by Mix et al. [1995].
s846isocibsmooth.txt = data shown in figures 2 and 3. These are original Cibicidoides data linearly interpolated to a uniform 3-kyr spacing and smoothed with a five-point running mean.
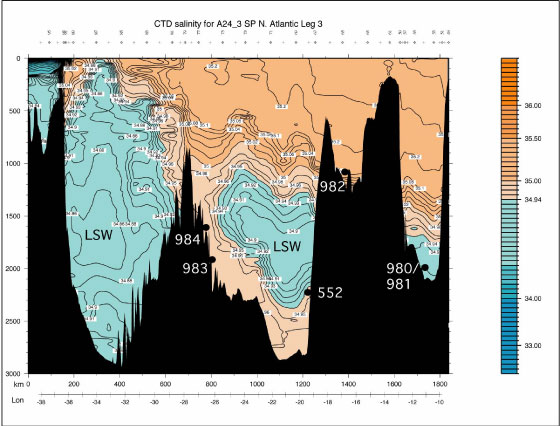
Supplementary figure: CTD salinity measurements made on WOCE N. Atlantic Leg 3. Site locations are projected onto transect. 983 and 984 are located on the eastern flank of the mid-Atlantic ridge; the other sites are located on the Rockall Plateau; LSW = Labrador Sea Water. This figure was modified from a data file provided by Lynne Talley.
References cited:
Flower, B.P., D.W. Oppo, J. F. McManus, K. Venz, D. Hodell, and J. Cullen, North Atlantic intermediate to deep water circulation and chemical stratification during the past 1 Myr, Paleoceanography, 15, 388-403, 2000.
Kleiven, H., E. Jansen, W. Curry, D.A. Hodell, and K. Venz, Atlantic Ocean thermohaline circulation changes on orbital to suborbital timescales during the mid-Pleistocene, Paleoceanography, 18, 10.1029/2001PA000629, 2003.
McIntyre, K., A.C. Ravelo, and M.L. Delaney, North Atlantic Intermediate Waters in the late Pliocene to early Pleistocene, Paleoceanography, 14, 324-335, 1999.
McManus, J.F., D.W. Oppo, and J. Cullen, A 0.5-million-year record of millennial-scale climate variability in the North Atlantic, Science, 283, 971-975, 1999.
Mix, A.C., J. Le, and N. J. Shackleton, Benthic foraminiferal stable isotope stratigraphy of Site 846; 0-1.8 Ma, Proceed. Ocean Drill. Prog., Sci. Res., 138, 839-854, 1995.
Oppo, D.W., J.F. McManus, and J.L. Cullen, Abrupt climate events 500,000 to 340,000 years ago; evidence from subpolar North Atlantic sediments, Science 279, 1335-1338, 1998.
Raymo, M.E., W.F. Ruddiman, J. Backman, B.M. Clement, and D.G. Martinson, Late Pliocene variation in Northern Hemisphere ice sheets and North Atlantic deep water circulation, Paleoceanography, 4, 413-446, 1989.
Raymo, M.E., K. Ganley, S. Carter, D. W. Oppo, and J. McManus, High latitude climate instability in the Early Pleistocene, Nature, 392, 699-702, 1998.
Ruddiman, W.F., M.E. Raymo, D.G. Martinson, B.M. Clement, and J. Backman, Mid-Pleistocene evolution of Northern Hemisphere climate, Paleoceanography, 4, 353-412, 1989.
Shackleton, N. J, and M. A. Hall, Oxygen and carbon isotope stratigraphy of Deep Sea Drilling Project Hole 552A: Plio-Pleistocene glacial history, Initial Rep. of the Deep Sea Drill. Proj., 81, 599-610, 1984.
Shackleton, N.J., A. Berger, and W. Peltier, An alternative astronomical calibration of the lower Pleistocene timescale based on ODP Site 677, Trans. Roy. Soc. Edinburgh: Earth Sci., 81, 251-61, 1990.
Venz, K. A. and D. A. Hodell, New evidence for changes in Plio-Pleistocene deep water circulation from Southern Ocean ODP Leg 177 Site 1090, Palaeo. Palaeo. Palaeo. 182, 197-220, 2002.
Venz, K. A., D. A. Hodell, C. Stanton, and D. A. Warnke, A 1.0 Myr record of glacial North Atlantic intermediate water variability from ODP Site 982 in the Northeast Atlantic,Paleoceanography 14, 42-52, 1999.
LATE PLIOCENE ODP662 BENTHIC O18 DATA: TROPICAL ATLANTIC ~1.5-3.5 m.y.
When using this data please reference: Lisiecki, L. E., and M. E. Raymo (2005), A Pliocene-Pleistocene stack of 57 globally distributed benthic d18O records, Paleoceanography, 20, PA1003, doi:10.1029/2004PA001071.
Data presented with LR04 timescale and +0.64 per mil adjustment added to Cib sp. data. Please contact me if you are interested in the benthic C13 data.
DSDP SITE 607 BENTHIC ISOTOPE RECORD
The following five data files are downloadable from NGDC (link provided):
s607sampleids.txt = This file shows corresponding sample ids (core-section-depth) for the meters composite depth scale.
s607ageCK92.txt = This file shows Cande and Kent [1992] paleomagnetic age model picks used at 607 (this is the age model used in Raymo and Nisancioglu [2003]). This age model is based on spreading rate analysis with two astronomically controlled calibration points (0.78 and 2.6 m.y.). The Berggren et al. [1995] paper discusses radiometric dates that support these calibration picks.
Cande and Kent, 1992, A new geomagnetic polarity time scale for the late Cretaceous and Cenozoic, JGR v. 97, B10, 13917-13951.
Berggren, W., F. Hilgen, C. Langereis, D. Kent, J. Obradovich, I. Raffi, M.E. Raymo and N.J. Shackleton, 1995, Late Neogene chronology: New perspectives in high resolution stratigraphy. Geol. Soc. Amer. Bull., v. 107, p. 1272-1287.
Raymo, M.E. and K.H. Nisancioglu, 2003, The 41 Kyr world: Milankovitch’s other unsolved mystery, Paleoceanography, v. 18, 10.1029/2002PA000791.
s607ageSBP90.txt = This is the orbitally tuned age model for the 0-1.8 m.y. section used in Raymo et al. [2004]. It is based on 84 tie lines to the Shackleton, Berger, and Peltier [1990] composite tuning target which used to be posted at: http://www.esc.cam.ac.uk/delphi/coredata/v677846.html
Raymo, M.E., D.W. Oppo, B.P. Flower, D.A. Hodell, J. McManus, K.A. Venz, K.F. Kleiven, K. McIntyre, 2004, Stability of North Atlantic water masses in face of pronounced natural climate variability, Paleoceanography, v. 19, PA2008, doi:10.1029/2003PA000921. .
Shackleton, N.J., Berger, A. and Peltier, W.R., 1990, An alternative astronomical calibration of the lower Pleistocene timescale based on ODP Site 677. Trans. R. Soc. Edinburgh, Earth Sci.,81: 251-261.
A note about the two 607 data files below: A few people have pointed out to me that the 607 d18O data run on the Finnigan MAT 251 at Lamont Doherty in the 1980s have a noticeable offset when compared to more recent analyses done at site 607 (the Lamont data is typically lighter by a few tenths of a permil). The most likely reason for this is contamination of sample gas by reference gas during ionization in the source of the early Finnigan instrument. This problem was not recognized until the 1990s when various labs started quantifying and correcting for this instrument effect (after 1990 my lab began using a VG Prism which did not have this problem). Apparently, Finnigan later re-engineered their source so reference gas contamination is no longer a problem. Correcting the data to the carbonate standards did not fix this bias as the standards (NBS-20, Bahama oolite, etc,) had lighter isotopic O18 values than the benthic foraminifera and thus were not as badly contaminated by the reference gas in the source (which was also isotopically light). Unfortunately, at this point twenty years later, there are too many unknowns to correct this data properly. This problem, which affected a number of labs, is discussed in more detail in Ostermann and Curry (Paleoceanography, 2000).
s607ageCK92isoadjmean.txt = 607 benthic isotope data plotted to Cande and Kent [1992] paleomagnetic time scale. This is data originally published by Raymo et al. [1989], Ruddiman et al. [1989], and Raymo [1992]. As described in Ruddiman et al. [1989], the uppermost part of record (0-915 cm) consists of a composite stack of previously published piston core data. For levels with duplicate analyses, the mean of the data is given. The Pleistocene interval includes both Uvigerina and Cibicidoides data (a data file with only Cibicidoides data is given below). To correct for species offsets: in the 607C13 column, the Uvigerina data has had 0.9 per mil added to it and in the 607O18 column 0.64 per mil has been subtracted from the Uvigerina data. In the 607O18adj column 0.64 per mil has been added to Cibicidoides data. Species adjustments after Shackleton and Hall [1984]. Please note that the 607 d18O data published in Ruddiman et al. [1986] was run on an earlier model mass spec, was found to be quite noisy, and eventually was all discarded and rerun.
Raymo, M.E., W.F. Ruddiman, J. Backman, B.M. Clement, and D.G. Martinson, 1989, Late Pliocene variation in Northern Hemisphere ice sheets and North Atlantic deep circulation. Paleoceanography, v. 4, p. 413-446.
Ruddiman, W.F., M.E. Raymo, D.G. Martinson, B.M. Clement, and J. Backman, 1989, Mid-Pleistocene evolution of Northern Hemisphere climate. Paleoceanography, v. 4, p. 353-412.
Raymo, M.E., 1992, Global climate change: a three million year perspective. In: Kukla, G. and Went, E. (eds.), Start of a Glacial, Proceedings of the Mallorca NATO ARW, NATO ASI Series I, Vol. 3, Springer-Verlag, Heidelberg, p. 207-223.
Shackleton NJ, Hall MA, 1984, Oxygen and carbon isotope stratigraphy of Deep Sea Drilling Project Hole 552A: Plio-Pleistocene glacial history. Initial Rep. of the Deep Sea Drill. Proj. 81:599-610.
s607/ch82isocib.txt = This file includes only Cibicidoides data. The age model down to 2.98 myr is orbitally tuned timescale of Shackleton, Berger, and Pelter [1990]; below this point age model is Cande and Kent [1992]. This data was published by Raymo et al. [1989], Ruddiman et al. [1989], and Raymo [1992]. As described in Ruddiman et al. [1989], the uppermost part of record (0-915 cm) consists of previously published piston core data, in this file Cibicidoides data from Ch82-24-4 [Boyle and Keigwin, 1985] and V30-97 [Mix and Fairbanks, 1985]. For levels with duplicate analyses, the mean of the data is given. No species adjustments have been made to this data.
Boyle, E.A., and L.D. Keigwin, 1985, Comparison of Atlantic and Pacific paleochemical records for the last 215,000 years: Changes in deep ocean circulation and chemical inventories, EPSL, 76, 135-150.
Mix, A.C. and R.G. Fairbanks, 1985, North Atlantic surface-ocean control of Pleistocene deep-ocean circulation, EPSL, 73, 231-243.
Raymo, M.E., W.F. Ruddiman, J. Backman, B.M. Clement, and D.G. Martinson, 1989, Late Pliocene variation in Northern Hemisphere ice sheets and North Atlantic deep circulation. Paleoceanography, v. 4, p. 413-446.
Ruddiman, W.F., M.E. Raymo, D.G. Martinson, B.M. Clement, and J. Backman, 1989, Mid-Pleistocene evolution of Northern Hemisphere climate. Paleoceanography, v. 4, p. 353-412.
Raymo, M.E., 1992, Global climate change: a three million year perspective. In: Kukla, G. and Went, E. (eds.), Start of a Glacial, Proceedings of the Mallorca NATO ARW, NATO ASI Series I, Vol. 3, Springer-Verlag, Heidelberg, p. 207-223.
VOSTOK ICE CORE DATA AND METHANE TIME SCALE
The following data was published in: Ruddiman, W.F. and M.E. Raymo [2003] A methane-based time scale for Vostok ice, Quaternary Science Reviews, 22, 141-155. [pdf]
vostok.ageRR03.txt = This is the “CH4” age model developed in paper.
vostokCO2ageRR03.txt
vostokmethaneageRR03.txt
vostokO18atmageRR03.txt = These three files present the Vostok carbon dioxide, methane, and atmospheric d18O records to the CH4 time scale of this paper (ageRR03). The GT4 time scale [Petit et al. 1999] and the Shackleton [2000] time scale (ageNJS) are given for comparison purposes. All the ice core data was downloaded from NGDC [Petit et al., 1999].
The CH4 time scale originally published by Ruddiman and Raymo [2003] incorrectly specified an age of zero years at a depth of 149.2 meters, the level of the uppermost methane analysis in the Vostok ice-core sequence. The age for this depth should instead be placed at 2.35 ka, as used by Petit et al. [1999]. The ages of all ice-core levels interpolated between this uppermost control and the first methane maximum at 321.2 meters (at 11,000 years ago) are increased accordingly. All ages from 11,000 through 344,000 years ago are those specified in Ruddiman and Raymo [2003]. Ages younger than 2.35 ka are extrapolated upward from our top two control points.
Petit, J. R., et al. (1999). Climate and atmospheric history of the last 420,000 years from the Vostok ice core, Antarctica. Nature 399: 429-436.
Shackleton, N. J. (2000) The 100,000-year ice-age cycle identified and found to lag temperature, carbon dioxide, and orbital eccntricity. Science 289: 1897-1902.
PLEISTOCENE ISOTOPE RECORDS: SITES 664, 677, 607 AND 552
The following four data files were published in Raymo, Oppo, and Curry [1997] and can be downloaded with their original timescales from NGDC (click here). See the README file at that site for additional information about files. Here, the files here have been recalibrated to the LR04 timescale of Lisiecki and Raymo [2005].
607iso_ageLR04_0-1.3ma.txt
552iso_ageLR04_0-1.3ma.txt
664iso_ageLR04_0-1.3ma.txt
677iso_ageLR04_0-1.3ma.txt